


Market Outlook for the week 23rd June to 27th June 2025 / CW25-2025
Weekly analysis of general market environment.


This post is an attempt to have an idea about general market health and to forecast what possibly can happen for the next week ahead. This is 53nd post in this series. Check the last week outlook here..
As a technical analyst “I anticipate but confirm. I wish but only react.”
No holidays next week.
Global Markets
US markets were mostly flat and little down, with some volatility.
NASDAQ flat -0.02%, S&P flat -0.15%, DJI flat +0.02%, RSP flat +0.17%, RUSSEL2000 up +0.74% this week. VIX was also flat -0.96%.
European indices continued their down move for 2nd week now all were down >1%.
Dollar Index (DXY) was up for the week after break down in last week. Still trend is down fall may continue.
1 distribution day added this week and 0 expired. Now count is 5 in 30 days in Russel 2000. 2 will expire next week.
Russel 2000 had a PB trading sideways along with 21dema, this week and last week’s low is now an important pivot. Below that trend will head down.

Let see how our markets look like for now
General Market
Are we in a long-term Up trend or Down trend (The Trend)?
Where are we located in the trend (start, mid, extended)? How old the trend is?
We are in mid of down trend and in (were🤷♀️ ) 2nd counter wave up within the down trend. The counter wave was extended & now showing a hint of fresh down wave for 2 weeks, its not confirmed yet. But series of -ve divergences always lead to a down wave in past.
Check below chart with trend divergences mentioned.
We are in the Mid of down trend, which is 38-39 weeks old.

A down trend or correction phase can last for 60 to 72 weeks (15-18 months) in general. With 3 or 4 down waves. What market breadth Trend indicators showing? (Within 15% & 30% of 52W-H/L range count, stocks above 50 & 200dema counts etc..,)
Trend indicators are now inline with the indexes which were going up with forming series of -ve divergences with last pivot highs now heading down. Too early to call next wave down as the market move should confirm this, but definitely 2 weeks down move is a serious warning.
We can see a recent negative divergence with the last pivot high which lead the price down for 2 weeks. Check the below image of Small & Mid cap spread index with intermediate and long term trend indicators. Divergences marked with blue lines. Note that in every bull run the bottom 2 long term indicators made a new high along with the mentioned index crossing above previous pivot highs.

Long term trend indicators are still in lower half levels confirms the down trend. Number of stocks above 200dema made a move above 50% but look like not surviving. Bear market is intact.
Is the Trend in transformation phase?
There were few signs of transformation 2 weeks ago, like stocks above 200dema count at 50%, Indices charts showing clear up trend, which was backed by good news flow. But all the signs looking weak now, a typical nature of bear market counter rallies. No transformation of trend so far we are still in the 2nd half of bear market.
All -ve divergences looks like now materializing, and it is a good thing to neutralize these for the uptrends too. We are marking the current down swing as 3rd wave down tentatively lets see how it reveals.

1. 1st Wave down -- 24th Sep to 18th Nov --  55 days
2. 1st Wave up   -- 18th Nov to 12th Dec --  24 days
3. 2nd Wave down -- 12th Dec to  3rd Mar --  81 days
4. 2nd Wave up   -- 3rd  Mar to 10th Jun --  99 days (Not confirmed)
3. 3rd Wave down -- 10th Jun to ________ --  _______ (tentative)

Formation of LL, LH in the above chart will confirm the next down wave or a new HH from here will invalidate and up wave to continue.
Are we in Up/Down/Flat-swing within the trend (The Swing)? Where are we located in the swing (start, mid, extended)? How old the swing is?
The down swing started on 11th June continued this week now near over sold levels and a bounce for one day.
Late Down Swing, which is 8 days old.
What market breadth Swing indicators showing? (ADV/DEC ratio, New 52W-H/L count, UP/Down >4% in a day count, up 15%+ in 5days count, 10 & 20dema breadth counts etc..,)
Swing indicators are inline with above, we can see a positive swing indicators for a day but one day change is not enough to mark the upswing since the down swing didn’t go deep oversold.
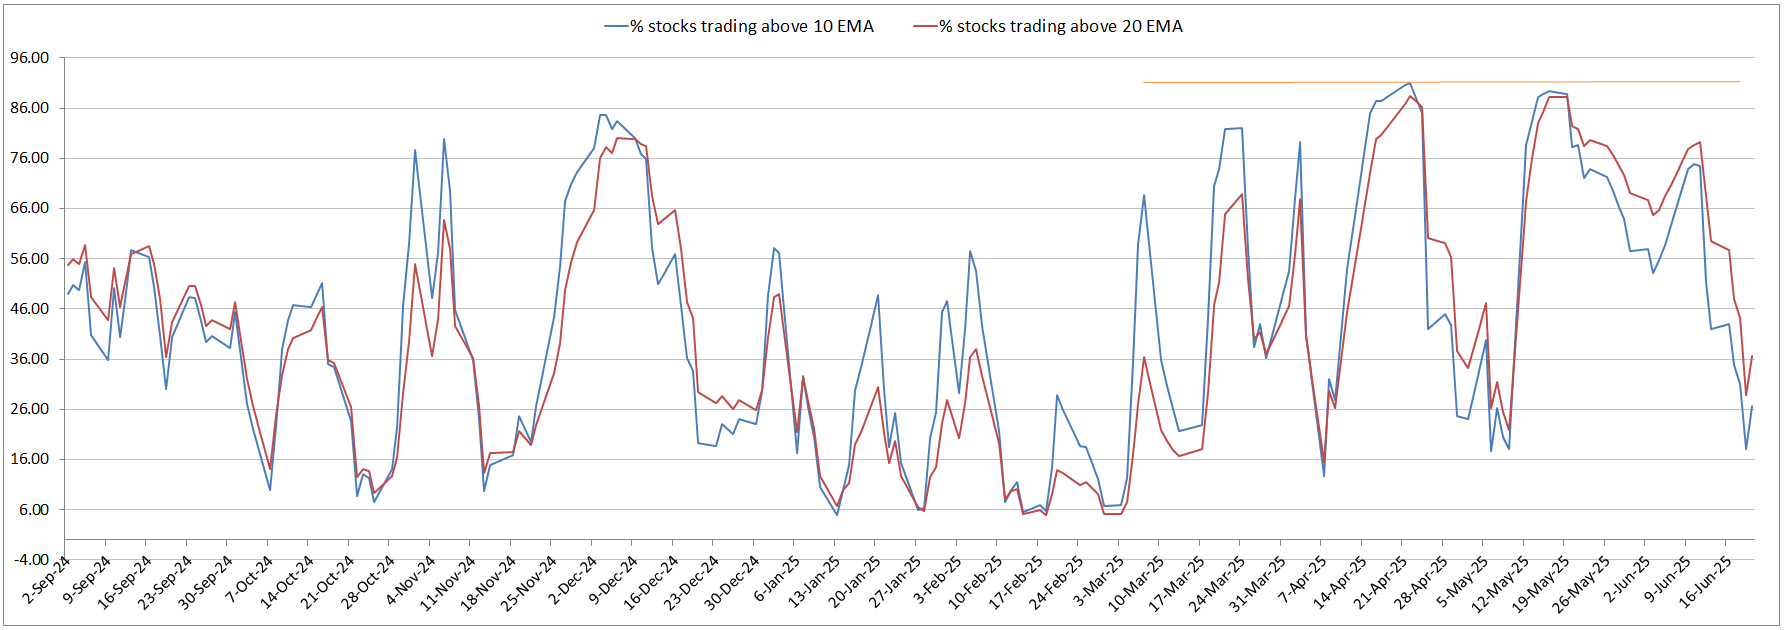


Note: But the volumes on this down swing was on lower side and the one day recovery is with good volumes which is a positive sign.
What types of stocks are moving (largecap, mid & smallcap, growth, junk etc)?
Large caps did well this week, Large caps fell less and recovered strong relatively.
Notable observations in Sectoral indices and Thematic industries?
Lot of sectoral rotation happened this week, many moved to down from sideway & weakening uptrend and some moved to rally attempt. Ones which didn’t fall much made a good recovery when market supported.

Pharma and Healthcare now moved to sideways from rally attempt. Banks, Finance, IT, Auto, Consumption didn’t fall much at the start of this week and recovered well towards the end.
On RRG charts Pharma, Healthcare, entered into Leading quadrant by gaining RS but losing momentum. IT was the top performer moved into Leading with high momentum.
Auto, commodities, consumption, Infra, FMCG, Consumer Durables, Oil & Gas, Private Banks are now in improving quadrant. Opportunities may possible in these.
PSU Banks, Media, Realty entered into lagging from leading.

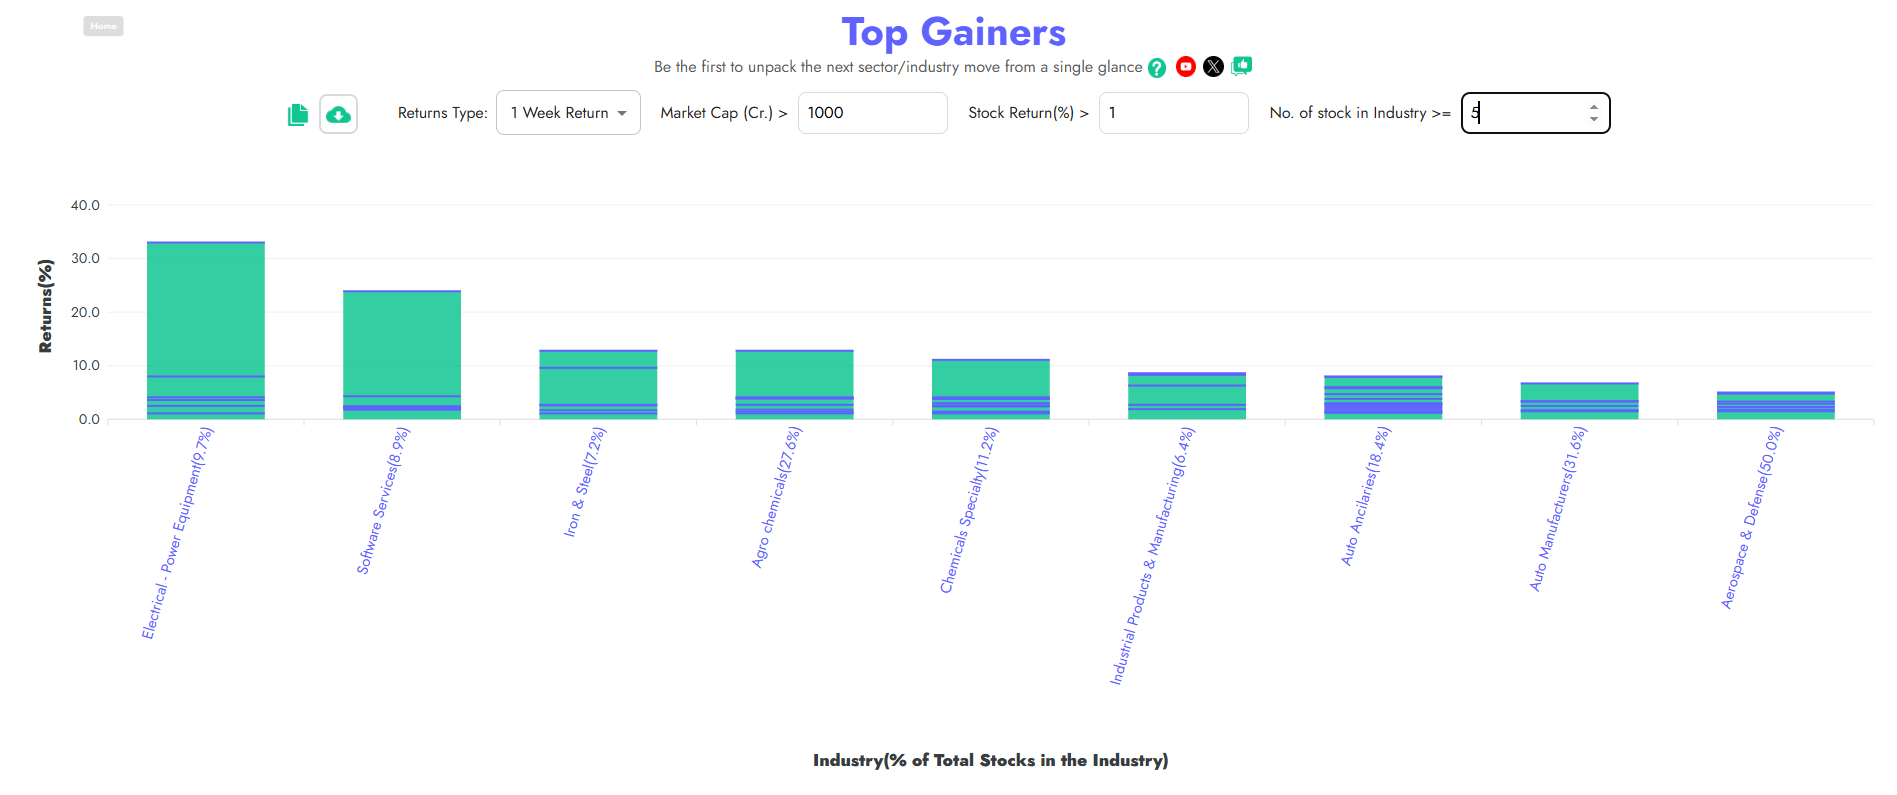
Below thematic industries out performed the broader market. Market was down hence the poor participation but Electrical Products, Software Solutions, Specialty Chemicals, Auto ancillaries are doing good from 2-3 weeks.
Are the breakouts working in last few trades?
No break out setups and lot of earlier break outs failed now not a good fed back.
Any event which can affect market coming week?
War news is the one thing to worry creating lot of volatility.
Summary
Trend: Mid Down,
Wave: Late 2nd counter Up or an early down no clarity.
Swing: Late Down Swing,
What possibly can happen next week? and what to do?
We are in a late down swing with one day relief, need another day or two to get clear swing direction. Same with the wave need confirmation.
Better to just wait for the first half of the week, we observed not much participation in the recent up move, so even an up move will be narrow only. Just observe the market.
Market conditions are not suitable for short trades as well, swing is extended on down side and global uncertainties can result in both side volatility.
Marking current swing confidence as 0.00, its better not to take any risk on either side.
Some industries/sectors are relatively strong, one can continue to hold on if PF have any open positions which are doing good as per the PF objectives.
Expecting the down swing to continue for the first half of next week with some relief days in between.
Thanks & That’s all for the week, Good luck. I will update in comments if any interesting development happens.
Disclaimer: This post is for my own record and not a financial guide or advice. I am not a qualified financial advisor nor an influencer, Please do your due diligence and contact your financial advisor before investing in capital markets.